Market crashes bring the commodity vs equity debate to the forefront as investors look for safer options. Economic downturns typically hurt equities through declining corporate profits, while commodities-especially gold-emerge stronger as safe-haven assets.
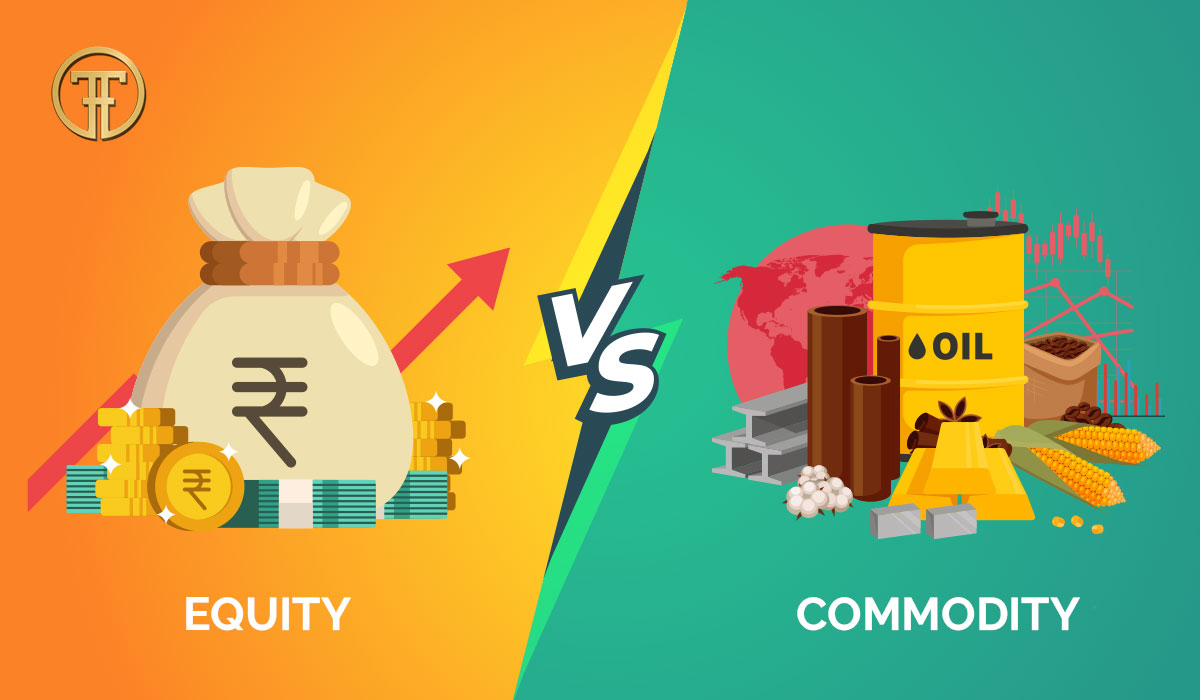
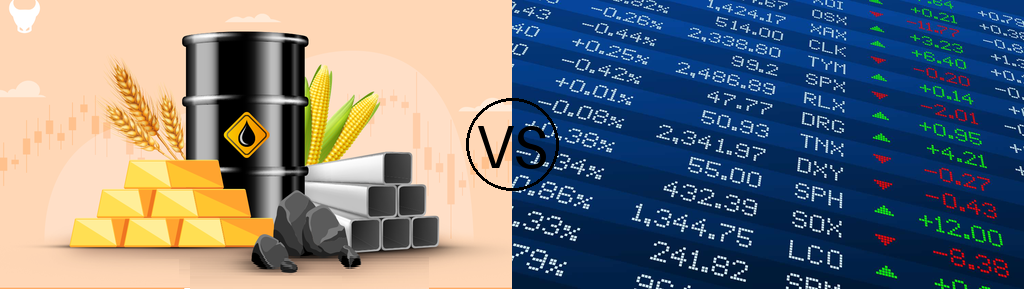
Equity and commodity markets operate on different fundamental drivers. Business performance and market sentiment shape stock markets directly. Supply-demand dynamics and geopolitical events drive commodity prices.
Both investment types offer unique advantages. Stocks attract investors with dividend potential and long-term growth prospects. Commodities serve as effective inflation hedges. Stock markets provide better liquidity consistently, but commodities’ protective value shines during volatile periods.
Let’s examine these investment options’ performance during market crashes. This knowledge will help you make smart decisions aligned with your financial goals and risk tolerance. Your portfolio’s protection depends on understanding how these assets behave when markets become turbulent.
Historical Performance: Commodities vs Equities During Major Market Crashes
Market crashes throughout history reveal clear patterns in commodity and equity responses to economic stress. A look at major downturns since 1970 gives great insights to investors who want to protect their portfolios.
Gold has shown remarkable resilience during stock market crashes. The S&P 500 posted negative returns in nine years while gold delivered average gains of 19.4% compared to S&P 500 losses of 15.3%. Gold prices dropped initially but bounced back strongly during the 2008 financial crisis and rose more than 25% over the 18-month stock market selloff. This trend continued as gold prices surged from ₹61,597 to ₹109,694 between October 2008 and October 2010.
Industrial metals struggle during market crashes and fall 35% peak-to-trough on average during recessions. Energy commodities show mixed results and decline approximately 23% peak-to-trough. Energy prices continued to spike for about six months after the recession began in two-thirds of recessions.
COVID-19’s market conditions were unprecedented. The stock and oil markets’ performance was a big deal as it means that it surpassed the 2008 financial crisis. The Sensex crashed 3,935 points (13.2%) on March 23, 2020. Financial and non-financial stocks’ correlation dropped during this period.
Commodities defied expectations during the early 2022 market correction. The NASDAQ dropped 15% while the S&P GSCI (a commodities index) returned 3% over five days and 8% year-to-date.
The 2008 financial crisis stands out as an extreme case for commodities. Six of twelve major commodities hit their worst peak-to-trough declines of any recession, and three others saw their second-worst declines. Gold remained a standout performer amid this turmoil, which shows why many investors call it a vital hedge against market crashes.
Understanding the Difference Between Equity and Commodity Market Behavior
The main difference between equity and commodity markets shows up in what drives them and how they work. Equity markets deal with company ownership and react to corporate performance, earnings reports, and economic conditions. The commodity markets, however, trade physical goods where supply and demand set the prices.
Supply and demand affect commodity prices by a lot. To name just one example, when bad weather or natural disasters create shortages, agricultural commodity prices go up. Equity values work differently – they change based on company performance, industry trends, and how investors feel about the market.
These markets react differently when economic conditions change. Commodity markets usually do well during inflation as goods become more expensive. Studies show that when US inflation surprises markets by 1 percentage point, commodities gain 7 percentage points in real returns. Stocks and bonds, however, drop by 3 and 4 percentage points.
Commodity prices swing more wildly than equity prices. These bigger swings happen because commodities react strongly to unexpected events like political conflicts, weather changes, and supply chain problems. On top of that, equity markets offer better liquidity with smaller gaps between buying and selling prices.
The way these markets operate differs too. Commodity trading runs longer (9:30 am to 6:30 pm) than equity trading (9:15 am to 3:30 pm).
Investors approach these markets with different goals. People invest in equities to build wealth over time, while commodity trading serves shorter-term goals or helps protect against risk. Producers often use commodity futures contracts to lock in prices and protect themselves from price changes.
Learning about these basic differences helps investors make better choices about where to put their money based on their financial goals, comfort with risk, and market conditions.
Correlation Patterns: When Commodities and Equities Diverge
The relationship between commodities and equities changes a lot based on market conditions. This gives us key insights about portfolio diversification. Research shows these correlations keep changing and are not fixed.
Financial Crisis Impact
The 2007-2008 financial crisis changed everything about how commodities and equities relate to each other. The relationship between oil and stock prices was positive before the crisis. This changed to strongly negative during the crisis. Stock indices became more connected with commodities at this time. The data shows 43 out of 45 indices had stronger connections.
Recession vs. Expansion Dynamics
Industrial metals show an interesting pattern in predicting stock returns:
- During economic contractions: Higher metal prices signal better stock returns
- During expansions: Rising metal prices point to lower returns, which hints at economic overheating
This effect is a big deal as it means that European markets react the same way.
Gold’s Unique Safe-Haven Status
Gold behaves differently from other commodities. It moves in the opposite direction to the S&P 500 most of the time. This negative relationship gets stronger when stock prices fall. Yes, it is more negatively correlated during bad market times and high volatility. That’s why portfolios with just 5-10% gold often perform better than those with only stocks.
Regional Variations
Location plays a key role in how these relationships work. Emerging Asian markets move much less with commodities than developed markets do. Latin American stocks show stronger ties to commodities. Less developed markets benefit more from agricultural and precious metals for diversification.
After 2004, commodities and equities started moving together more. This trend partly reversed after 2010, giving investors better ways to spread their risk. Through all these changes, we learned that commodities can’t be treated as one group. Each commodity responds differently to economic changes and market conditions.
Comparison Table
| Characteristic | Commodities | Equities |
|---|---|---|
| Performance During Market Downturns | Gold averaged +19.4% gains during S&P 500 negative years | Average losses of 15.3% during down years |
| Main Market Drivers | Supply-demand dynamics and geopolitical events | Business performance and market sentiment |
| Response to Inflation | +7% real return per 1% inflation surprise | -3% return per 1% inflation surprise |
| Trading Hours (Indian Market) | 9:30 AM to 6:30 PM | 9:15 AM to 3:30 PM |
| 2008 Financial Crisis Performance | Gold rose 25% over 18-month period; Industrial metals fell 35% peak-to-trough | Heavy losses (specific % not mentioned) |
| COVID-19 Crash Effect | Mixed performance (specific % not mentioned) | Sensex crashed 13.2% (3,935 points) on March 23, 2020 |
| Liquidity Characteristics | Lower liquidity, wider bid-ask spreads | More consistent liquidity, tighter spreads |
| Main Investment Purpose | Short-term objectives and hedging | Long-term wealth creation |
| Volatility | Higher price fluctuations | Relatively lower price fluctuations |
Conclusion
The performance patterns of commodities and equities during market crashes teach us valuable lessons about strategic portfolio management. Gold has shown remarkable resilience through the years. The numbers tell an interesting story – gold gained an average of 19.4% during times when the S&P 500 fell 15.3%. This makes gold a reliable safe-haven asset when markets get rough.
Commodity markets work differently than equity markets. Supply and demand shape commodity prices, while business performance and investor sentiment move equity markets. Industrial metals and energy commodities often struggle in downturns. Their behavior changes a lot based on market conditions. The 2008 financial crisis showed this clearly. Most commodities saw steep declines, but gold stood out with a 25% gain over 18 months.
These asset classes’ correlation patterns change dramatically during stressful market periods. Gold’s negative correlation with equities becomes stronger during market crashes. That’s why portfolios with 5-10% gold allocation typically perform better than pure equity portfolios on a risk-adjusted basis.
Smart portfolio protection during market crashes needs a good mix of both asset classes. Equities provide better liquidity and long-term growth potential. Commodities – especially gold – are great ways to get diversification benefits when markets become volatile. A deep understanding of these relationships helps build investment strategies that can handle various market conditions well.