Most investors assume that holding five or six mutual funds automatically means they’re diversified. Then a market correction hits, and every single fund in the portfolio falls by roughly the same percentage on the same day. That’s not bad luck — that’s portfolio overlap, and starting this August, SEBI is making it a lot harder for fund houses to hide it.
Under SEBI’s revised Mutual Fund Regulations, 2026, asset management companies now have to disclose category-wise portfolio overlap levels on a monthly basis, with compliance timelines running through August 2026. For the first time, retail investors will have a standardised, regulator-mandated way to see exactly how much their funds actually overlap — instead of guessing based on fund names or category labels. At Techolic, we think this is one of the most useful disclosures SEBI has introduced in years, and most investors won’t know how to read it when it lands. This article fixes that.
What Exactly Is Portfolio Overlap?
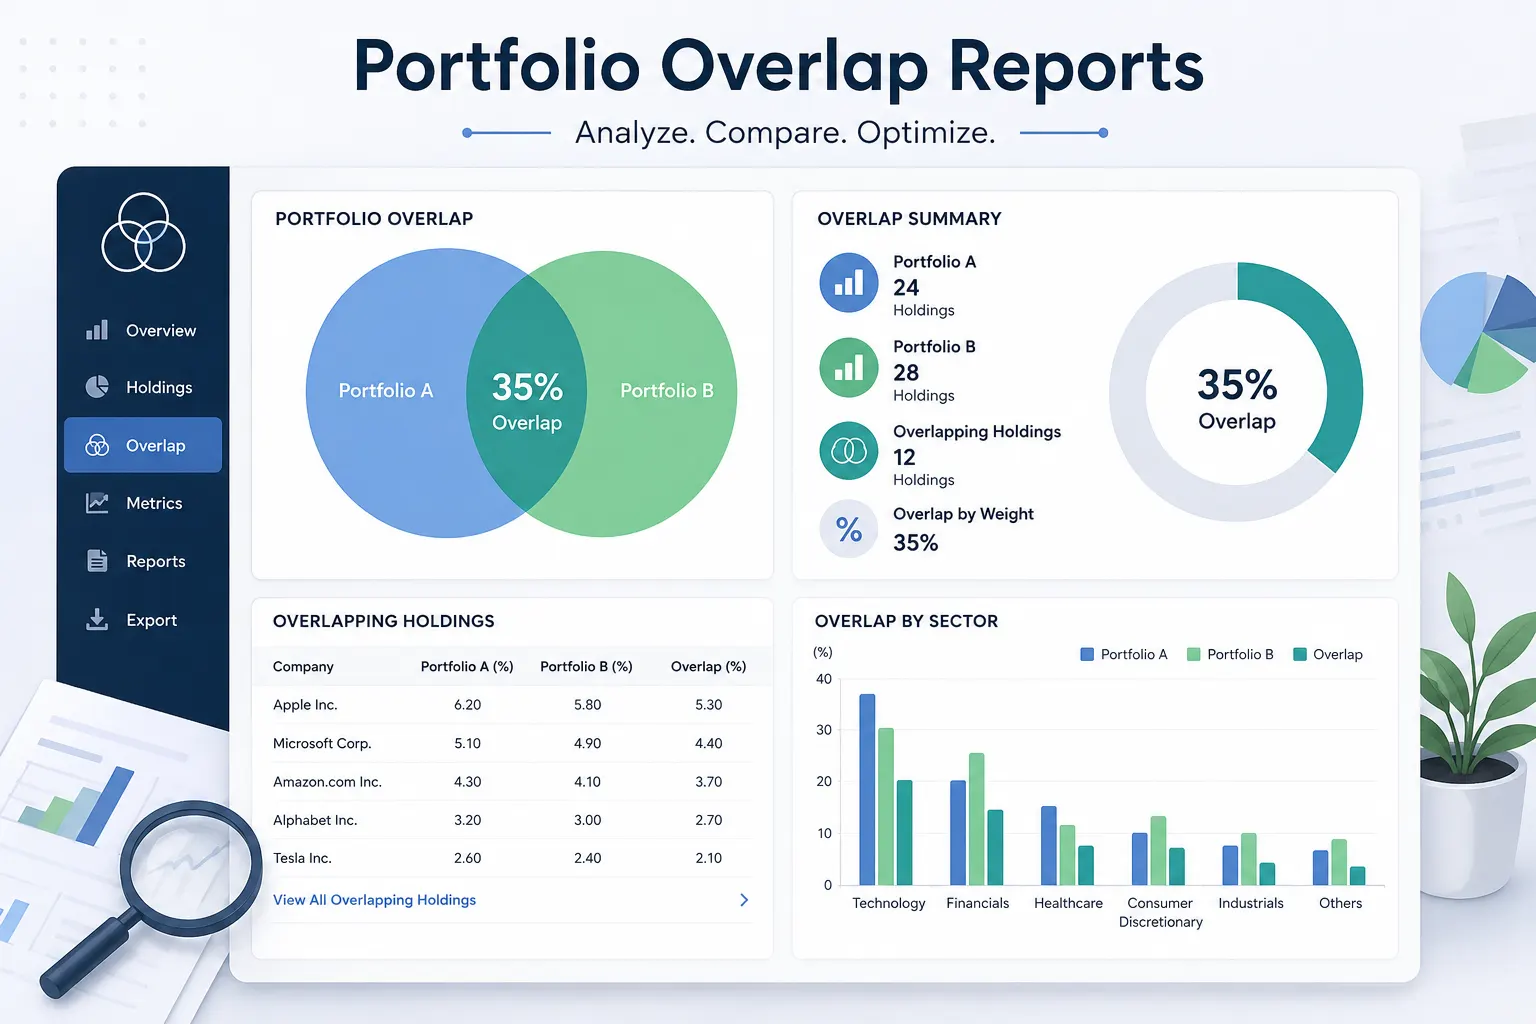
Portfolio overlap simply means two or more mutual funds you hold end up owning the same underlying stocks. If your flexi-cap fund and your large-cap fund both hold HDFC Bank, Reliance Industries, and Infosys as top holdings, that’s overlap. The higher the overlap percentage, the more your “different” funds are really just one fund wearing two labels.
Here’s why this matters more than most investors realise: overlap doesn’t show up in the fund’s individual performance numbers. Each fund can post a perfectly respectable return on its own. The damage is invisible until you zoom out and look at your entire portfolio together, at which point you often discover you’re not diversified across ten funds — you’re concentrated in the same twenty or thirty stocks, just split across multiple statements.
Why Is SEBI Mandating Portfolio Overlap Reports Now?
SEBI’s push comes from a broader overhaul of mutual fund categorization rules issued in February 2026, aimed at closing a long-standing gap between how funds are marketed and what they actually hold. The regulator has specifically capped overlap between sectoral and thematic equity schemes and other equity schemes at 50%, with large-cap funds exempted from this particular limit. Fund houses computing overlap quarterly, based on the average of daily portfolio values, and disclosing it monthly on their own websites, is the practical outcome of this rule.
The underlying problem SEBI is addressing is what’s often called closet indexing — funds that are marketed as distinct strategies but end up holding nearly identical portfolios to reduce tracking risk for the fund manager. It’s a low-risk approach for the AMC, but it quietly costs investors twice the expense ratio for what is effectively the same exposure.
Where Will You Actually Find These Reports?
Once the disclosure norms are fully in effect, AMCs are required to publish category-wise overlap data on their own websites, updated monthly. This won’t be buried in a footnote of the factsheet — it’s meant to be a standalone, accessible disclosure, similar to how portfolio holdings and expense ratios are already published today.
Until fund houses roll this out consistently, you can still get a working sense of overlap using existing tools:
- Monthly portfolio disclosures already published by every AMC, which list every stock a fund holds along with its weightage
- Third-party mutual fund comparison platforms that let you paste two scheme names and instantly see the common holdings and overlap percentage
- Your Consolidated Account Statement from CAMS or KFintech, which lists every fund you hold and can be cross-checked manually against factsheets
Once the official SEBI-mandated reports go live, they’ll simply make this process faster and more standardised — you won’t need to manually compare factsheets fund by fund.
How Do You Actually Read a Portfolio Overlap Report?
This is where most investors get stuck — not because the report is complicated, but because nobody explains what the numbers actually mean for their money.
Look at the overlap percentage first, but don’t stop there. A 20–30% overlap between two funds is usually harmless and even expected, since most large-cap and flexi-cap funds will naturally hold some of the same blue-chip names. Overlap above 50–60% between two funds you’re paying separate expense ratios for is where it starts to matter.
Check which specific stocks are overlapping, not just the percentage. Two funds showing 40% overlap concentrated in the same three or four large-cap stocks is very different from 40% overlap spread across fifteen different stocks. Concentrated overlap in a handful of names means your portfolio’s fate is more tied to those specific companies than you might think.
Compare overlap across categories, not just within them. A large-cap fund and a flexi-cap fund overlapping in HDFC Bank or ICICI Bank isn’t unusual — both categories can legitimately hold large, stable businesses. What’s worth flagging is high overlap between funds marketed as genuinely different strategies, like a value fund and a growth fund showing significant common holdings.
Factor in your total allocation, not just fund count. Owning eight funds sounds diversified, but if two of them make up 60% of your invested amount and have high mutual overlap, your actual diversification is far weaker than the fund count suggests.
What Should You Do If You Discover High Overlap?
Finding overlap doesn’t automatically mean you need to sell anything immediately. Start with a calmer, more deliberate approach:
- Identify the purpose each fund is meant to serve. If two funds exist in your portfolio for genuinely different reasons — one for stability, one for higher growth potential — some overlap is acceptable as long as the core strategy differs
- Check the expense ratio you’re paying for the overlapping portion. If you’re paying two separate expense ratios for what is largely the same underlying exposure, that’s a direct, ongoing cost with no corresponding diversification benefit
- Consider consolidating gradually, not all at once. Redeeming a fund purely to fix overlap can trigger LTCG or STCG depending on your holding period, so plan the exit around your tax position rather than reacting to the report alone
- Reassess your fund selection process going forward. If overlap keeps showing up across your picks, it usually means funds were selected based on past returns or recommendations rather than how they’d fit together as a portfolio
Common Mistakes Investors Make With Portfolio Overlap
- Assuming more funds automatically means more diversification. Fund count is a weak proxy for actual diversification; overlap percentage and stock concentration tell the real story
- Ignoring overlap between funds from different AMCs. Overlap isn’t limited to funds within the same fund house — a flexi-cap fund from one AMC and a multi-cap fund from another can hold very similar top stocks simply because they’re chasing the same large, liquid names
- Reacting to overlap by selling in a hurry. A knee-jerk redemption can create unnecessary tax liability and exit load costs that outweigh the benefit of trimming overlap
- Confusing sector overlap with stock overlap. Two funds can avoid holding the exact same stocks while still being heavily concentrated in the same sector, like banking or IT — sector-level overlap deserves just as much attention as stock-level overlap
- Treating the overlap report as a one-time check. Fund managers change allocations regularly, so overlap that looked fine six months ago can shift meaningfully by the time the next disclosure is published
How Should You Use This Going Forward?
Once these reports become a regular, standardised disclosure from August onward, we’d suggest building a simple habit at Techolic: review portfolio overlap alongside your annual portfolio rebalancing, not as a separate exercise you forget about. Pull the overlap data for your top three or four holdings, check whether the overlap has grown since your last review, and use that as one input — alongside performance, expense ratio, and your own goals — for deciding what stays and what gets trimmed.
The real value of this disclosure isn’t just spotting overlap once. It’s finally having a reliable, regulator-backed way to confirm that the diversification you think you’re paying for is actually showing up in your portfolio.
Frequently Asked Questions
When exactly will SEBI’s portfolio overlap reports become available?
AMCs are working toward compliance with SEBI’s revised categorisation and disclosure norms by August 2026, after which category-wise portfolio overlap data will be published monthly on fund house websites.
What is considered a “high” portfolio overlap percentage?
There’s no single universal cutoff, but overlap above 50–60% between two funds you’re holding for supposedly different strategies is generally worth a closer look, especially if it’s concentrated in a small number of stocks.
Does portfolio overlap apply to debt and hybrid funds too?
Yes. SEBI’s disclosure requirement covers equity-vs-equity, debt-vs-debt, and hybrid-vs-hybrid overlap, not just equity schemes, though equity overlap tends to get the most attention since stock-level concentration is easier to visualize.
Should I avoid funds with any overlap at all?
No – some overlap is normal and even expected, particularly among large-cap-oriented funds that naturally hold the same blue-chip stocks. The goal isn’t zero overlap, it’s making sure you’re not paying multiple expense ratios for what is essentially one exposure.
Can portfolio overlap hurt my returns directly?
Overlap itself doesn’t reduce returns, but it reduces the diversification benefit you’re likely counting on, meaning your portfolio can behave more like one large concentrated bet than the balanced mix you intended, especially during a market downturn.
Where can I check overlap between my funds right now, before the official reports launch?
You can manually compare monthly portfolio disclosures already published by AMCs, or use existing mutual fund comparison tools that calculate overlap between two schemes based on their current holdings.