
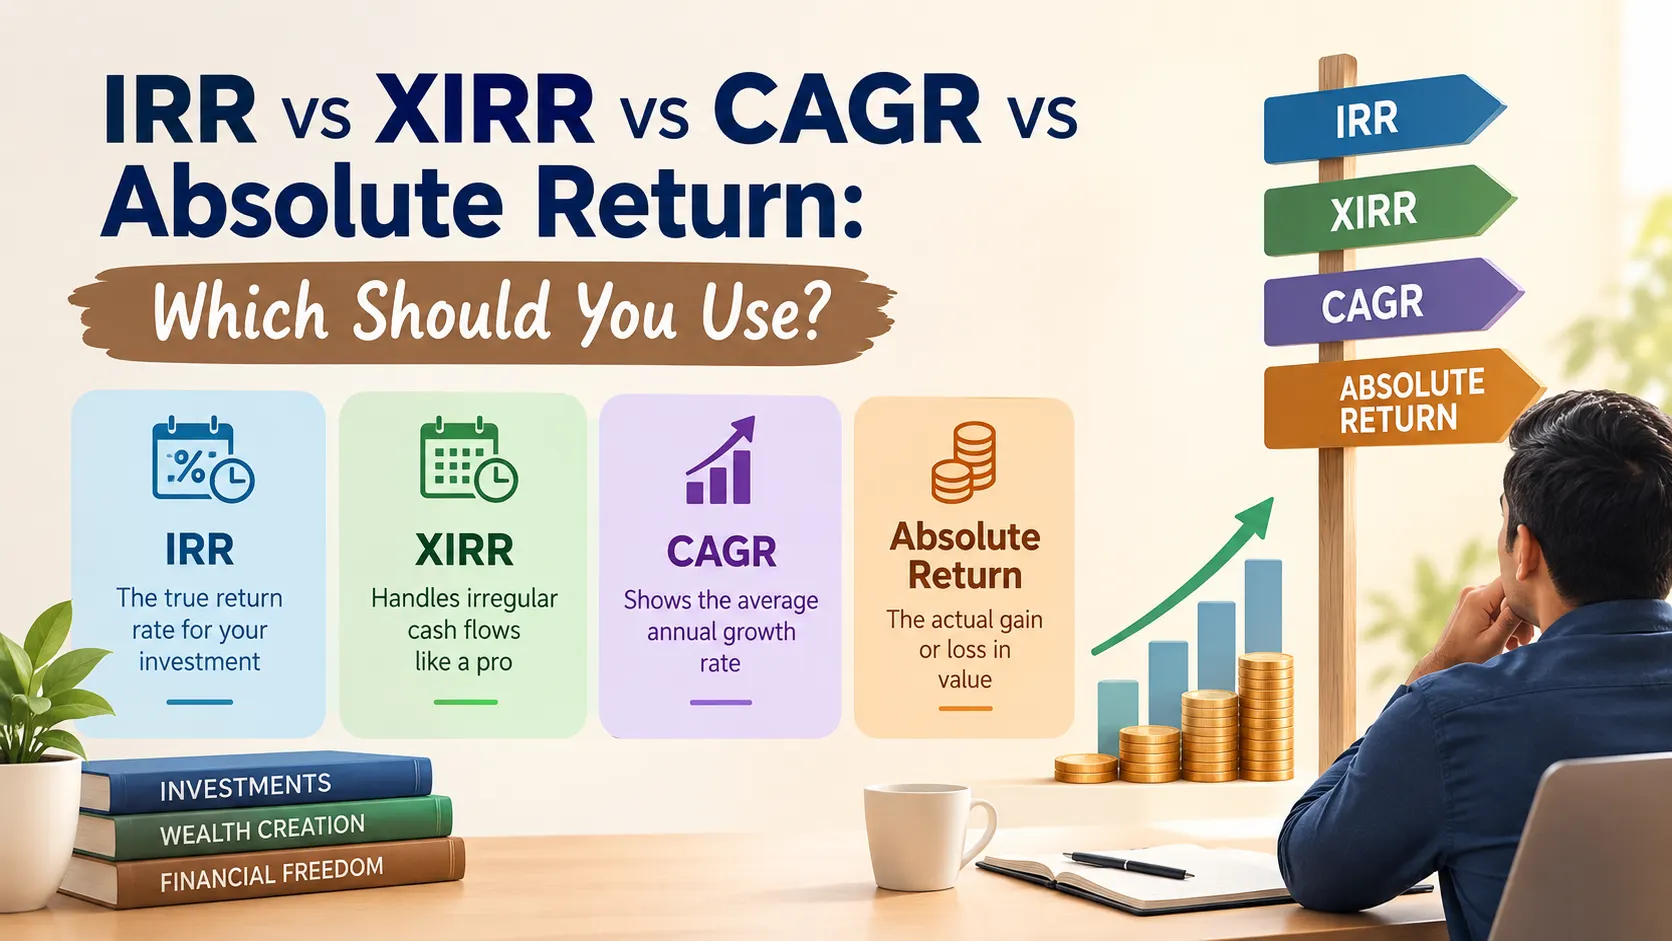
An 80% gain looks identical on paper whether it took five years or eight, yet the two outcomes are far apart. ₹1,00,000 growing to ₹1,80,000 in five years compounds at roughly 12.5% a year. The same ₹1,80,000 reached after eight years works out to about 7.6% a year. Absolute return calls both of them “80%”. That gap is why Indian investors see four different numbers (absolute return, CAGR, IRR and XIRR) sitting beside the same investment, and why picking the wrong one can make a portfolio look better or worse than it really is.
Each measure answers a different question. Some ignore time, some ignore the dates of your installments, and some only work when cash flows are evenly spaced. This guide explains what each one measures, runs all four on the same numbers, and settles the XIRR vs CAGR question that confuses most SIP investors. Every figure below is an illustrative assumption used to explain the maths, not a forecast or a promise of returns.
Quick answer
- Absolute return: total gain as a percentage of the amount invested. Ignores time. Best for holdings under a year.
- CAGR: the smoothed yearly growth rate for one investment and one exit. Best for comparing funds and lump sums.
- IRR: the rate per period for several cash flows spaced at equal intervals. Useful for yearly-premium policies and fixed-interval flows.
- XIRR: the annualised rate for several cash flows on any dates. Best for SIPs, top-ups and partial withdrawals.
What Is Absolute Return, and When Is It Enough?
Absolute return is the total profit or loss on an investment, expressed as a percentage of the amount you put in.
Formula: (Current value − Amount invested) ÷ Amount invested × 100
If ₹50,000 invested in a stock is worth ₹58,000 today, the absolute return is 16%. It tells you how much you have gained, not how quickly you gained it.
Where it works: holdings of under a year, a quick check on a stock trade, or comparing gains over similar time frames. Fund factsheets follow the same habit: returns for periods up to a year are generally shown as absolute figures, and longer periods are annualised.
Where it fails: comparing investments held for different lengths of time. A 40% gain in two years and a 40% gain in six years are very different results, and absolute return cannot tell them apart.
What Is CAGR and Why Do Fund Factsheets Use It?
CAGR, or compound annual growth rate, is the steady yearly rate that would take one starting amount to one ending amount over a given period.
Formula: (Ending value ÷ Beginning value)1 ÷ Number of years − 1
Take the opening example. ₹1,00,000 becoming ₹1,80,000 in five years gives 1.81/5 − 1, which is about 12.5% a year.
No real fund grows at a steady 12.5%. One year may return 30% and the next may lose 10%. CAGR simply smooths that bumpy path into one number, which is why 3-year and 5-year mutual fund returns are quoted this way. It makes different schemes and different time periods easy to line up.
Where does CAGR fall short?
- It sees only two cash flows, one going in and one coming out. That rules out SIPs.
- It is sensitive to start and end dates. A 5-year CAGR measured just after a sharp fall looks very different from the same fund’s figure a year earlier. Rolling returns reduce this problem.
- It hides volatility. Two funds with the same CAGR can put you through very different rides.
What Is IRR and How Is It Different from CAGR?
IRR, or internal rate of return, is the single rate at which the money you put in and the money you get back balance out to zero once time value is accounted for. Unlike CAGR, it can handle many cash flows, not just one in and one out.
The catch is the assumption of equal gaps. IRR treats every cash flow as if it arrived one period after the previous one, whether that period is a month or a year. Two things follow from this:
- The answer comes out per period. Monthly cash flows give a monthly IRR, and you must compound it to get an annual figure: (1 + monthly rate)12 − 1. Multiplying by 12 understates the true annual rate.
- If your cash flows are irregular, IRR quietly gives a wrong answer.
IRR is a good fit when the flows are naturally regular. Yearly premiums paid into an endowment policy against a maturity payout is the classic case, as are fixed monthly EMIs when you want to find the true cost of a loan.
What Is XIRR and Why Is It the Right Measure for SIPs?
XIRR stands for extended internal rate of return. It works like IRR, but instead of assuming equal gaps it uses the actual date of every cash flow, and it returns an annualised rate directly.
That is why most investing apps show XIRR against your SIP holdings. A rupee invested six months ago has had far less time to grow than a rupee invested four years ago, and XIRR weighs each one for exactly the time it stayed invested. It copes with skipped instalments, step-up SIPs, lump-sum top-ups, partial redemptions and IDCW payouts, as long as each is entered with its own date.
Sign convention: money leaving your pocket (installments) is negative. Money coming back (redemption proceeds, dividends, or the current market value) is positive.
At Techolic, XIRR is the first number we look at when reviewing how a client’s SIPs and lump sums have actually worked together, because it reflects the real dates on which the money went in.
How Do All Four Measures Compare on the Same Investment?
Two illustrative scenarios show where the numbers agree and where they split apart.
Scenario A: a lump sum
₹1,00,000 invested once, worth ₹1,80,000 after five years.
Absolute return: 80%
CAGR: about 12.5% a year
XIRR: about 12.5% a year
IRR (yearly periods): about 12.5% a year
With one investment and one exit, CAGR, XIRR and IRR land on the same answer. Only absolute return stands apart, because it says nothing about time.
Scenario B: a 12-month SIP
₹10,000 invested on the first of each month for 12 months (₹1,20,000 in total), with the holding valued at ₹1,32,000 twelve months after the first installment.
Absolute return: 10%
CAGR-style shortcut (₹1,32,000 against ₹1,20,000 over one year): 10%, which is misleading
XIRR: about 19% a year
IRR on monthly flows: about 1.46% a month, which compounds to about 19% a year
The shortcut is wrong because the ₹1,20,000 was never invested for a full year. Installments stayed in the market for between 1 and 12 months, about 6.5 months on average. A 10% gain earned on money that was invested for roughly half a year is a much higher annualised rate. Real Excel results may differ by a fraction of a percentage point because XIRR uses actual calendar days.
One caution on Scenario B: an annualised figure over just 12 months is mathematically correct but should not be read as a rate you can expect to keep earning. Short windows magnify small gains into eye-catching percentages, and XIRR is most meaningful over longer periods.
XIRR vs CAGR: Which One Should You Use?
Ask what you are evaluating.
Judging your own money: use XIRR. It reflects when you actually invested, so it is a personal number. Two investors in the same fund can have different XIRRs because they started on different dates or bought more units during a dip.
Judging an investment product: use CAGR. It measures what a single amount would have earned between two dates, no matter who invested when. That makes it the fairer yardstick for comparing funds.
This is also why putting your SIP’s XIRR next to a fund’s five-year CAGR is not a like-for-like comparison. One is shaped by your instalment dates and the other assumes a single lump sum. To judge whether your SIP is doing its job, set your XIRR against the effective yield on a fixed deposit and against inflation. Treat the fund’s CAGR over a similar period as a sanity check rather than a scorecard.
Which Measure Fits Which Situation?
The XIRR vs CAGR choice, along with the other two measures, comes down to the shape of your cash flows. This is the cheat-sheet we use at Techolic when investors ask which number to trust.
Sold a stock after seven months: absolute return. Annualising a short holding exaggerates the result.
Lump sum in a mutual fund for three years: CAGR. XIRR will give the same figure.
Monthly SIP running for years: XIRR.
SIP with top-ups, skipped months or partial withdrawals: XIRR.
Yearly-premium insurance policy against its maturity benefit: IRR, or XIRR if you want to use exact premium dates.
Comparing two funds over the same period: CAGR, backed by rolling returns and the benchmark.
Checking whether your overall portfolio has beaten a fixed deposit: XIRR.
What Are the Pros and Cons of Each Measure?
Before settling on XIRR vs CAGR, or on either of the other two, it helps to see what each one gives up.
Absolute return
Pros: simplest to calculate; sensible for holdings under a year.
Cons: ignores time entirely; misleading when holding periods differ.
CAGR
Pros: easy to compare across funds and periods; the standard in factsheets.
Cons: needs a single entry and a single exit; hides volatility; depends heavily on start and end dates.
IRR
Pros: handles multiple cash flows; well suited to insurance policies and fixed-interval flows.
Cons: assumes equal gaps between cash flows; gives a per-period rate that must be converted to an annual one.
XIRR
Pros: date-accurate; built for SIPs and portfolios with irregular flows; gives an annual rate directly.
Cons: exaggerates over short periods; specific to your own timing; hard to compute without Excel, Google Sheets or an app.
How Do You Calculate XIRR in Excel or Google Sheets?
Both tools use the same function.
- Put the dates in column A and the cash flows in column B, with the earliest date at the top.
- Enter every installment as a negative number.
- On the last row, enter the current value (or redemption proceeds) as a positive number, dated the day you are measuring on.
- In an empty cell, type =XIRR(B2:B14, A2:A14).
- Format the result as a percentage.
What should you watch out for?
- XIRR needs at least one negative and one positive cash flow. Without both, it returns an error.
- If your holding is in a loss, XIRR can fail to converge or show an odd value. Adding a guess as a third argument, such as =XIRR(B2:B14, A2:A14, -0.1), usually fixes it.
For an after-tax view, use the redemption value after tax and exit load rather than the gross figure.
What Are the Most Common Mistakes When Reading These Numbers?
- Treating XIRR vs CAGR as interchangeable. They match only for a single lump sum. Comparing a SIP’s XIRR with a fund’s stated CAGR mixes two different questions.
- Dividing final value by total invested and calling it CAGR. For a SIP, this ignores when each instalment went in and understates the annual rate.
- Trusting XIRR over a few months. Annualisation turns small short-term moves into dramatic figures.
- Multiplying a monthly IRR by 12. Compound it instead: (1 + monthly rate)12 − 1.
- Leaving out dividends or withdrawals. Any IDCW payout or partial redemption is a cash flow with its own date, and skipping it distorts the answer.
- Using absolute return to compare two investments held for different durations.
- Ignoring signs. Instalments and redemptions must carry opposite signs, or the formula returns an error or nonsense.
Can XIRR Alone Tell You Whether Your Investments Are Working?
No. XIRR tells you what your money earned given when you invested it. It does not tell you how much risk you carried, whether the fund beat its benchmark, or whether the portfolio is still suited to the goal it was built for. A high XIRR after a rising market and a low XIRR after a weak patch both say more about timing than about the quality of your decisions.
When we review a portfolio at Techolic, we treat XIRR as a diagnostic, not a verdict. We read it alongside the fund’s rolling returns, its benchmark and the time left to your goal. Equity funds in particular are meant to be judged over long horizons, and a short-term XIRR is a poor basis for a switch.
What Is the Simplest Rule to Remember?
- One investment, one exit, held over a year: CAGR
- Held for less than a year: absolute return
- Several investments or withdrawals on irregular dates: XIRR
- Several flows at equal intervals: IRR
Once you know what each number measures, the XIRR vs CAGR debate stops being confusing. Use the personal number for your own portfolio and the product number for comparing funds. If you would like a second opinion on how your SIPs and lump sums have really performed, the Techolic team can walk you through your portfolio’s XIRR and check it against your goals.
Mutual fund investments are subject to market risks. Read all scheme-related documents carefully. The examples in this article are illustrative and are not forecasts or guarantees of returns.
Frequently Asked Questions
What is the difference between IRR and XIRR?
IRR assumes the gaps between cash flows are equal, such as every month or every year, and returns a rate for that period. XIRR uses the exact date of every cash flow and returns an annualised rate. For a SIP with skipped months or top-ups, XIRR is the reliable choice.
Is XIRR the same as CAGR?
Only when there is a single investment and a single exit. In that case both give the same annual rate. Once money goes in at several dates, CAGR cannot account for the timing and XIRR can.
Which is better for a SIP, XIRR or CAGR?
XIRR. A SIP has many instalments on different dates, and each has been invested for a different length of time. XIRR weighs each one correctly, while CAGR treats the total as if it went in on day one.
Why is my XIRR much higher than the fund’s return?
Usually because of a short holding period or good timing. If your instalments came in during a dip, or the SIP is only a few months old, the annualised figure can look far higher than the fund’s 3-year or 5-year CAGR. Neither number is wrong. They measure different things.
Can XIRR be negative?
Yes. If the current value of your holding is lower than what you invested, XIRR turns negative. In Excel, a guess such as -0.1 as the third argument helps the formula converge.
What is a good XIRR?
There is no fixed number. It depends on the asset class, the holding period and how it compares with the effective yield on fixed deposits and with inflation. Equity returns vary a lot from year to year, so judge XIRR over the full horizon of your goal.